For years, financial advisors gave one big reason to convert money to a Roth individual retirement account (IRA) now: tax rates were set to go up in 2026. That increase never came.
A 2025 law called the One Big Beautiful Bill Act (OBBBA) made today’s tax rates permanent. But in tax law, permanent only means there is no end date written in. A future Congress can change rates at any time. The case for converting has not gone away. It has changed shape.
How a Roth IRA Works
Traditional and Roth IRAs are taxed at opposite ends of the trail.
- Traditional IRA. You may be able to deduct what you put in. What you take out is generally taxed as regular income.
- Roth IRA. You never get a deduction for what you put in. What you take out, including the growth, is tax-free once you meet a few rules, which we cover below.
Roth IRAs also have no required withdrawals while the original owner is alive.
What a Roth Conversion Actually Does
A Roth conversion moves money from a traditional IRA or 401(k) into a Roth IRA. You pay regular income tax on the amount you convert, right now, in the year you do it.
In exchange, that money can grow tax-free from then on. Once you meet the rules below, you do not pay tax on it again.
What Changed and What Did Not
The Tax Cuts and Jobs Act of 2017 lowered tax rates, but only for a while. Without new legislation, those rates were set to expire at the end of 2025 and rates were going up for almost everyone in 2026.
The OBBBA, signed July 4, 2025, made those lower rates permanent. So the scheduled increase is gone. What did not go away is uncertainty. Rates have changed many times before and they can change again.
The Terrain Ahead
Three things are worth watching:
- Tax brackets are low by historical standards. The federal rate on the highest incomes is 37% today. From 1932 through 1986, it never dropped below 50%. The bottom rate has been 10% since 2001, lower than in any year from 1942 through 2000. (It was lower in the early years of the income tax, before 1941.)
- Federal debt is near a record. Debt held by the public, meaning money the government owes to outside lenders, is about 101% of the size of the U.S. economy this year. The Congressional Budget Office projects it will pass its 1946 record of 106% and reach 120% by 2036.
- Social Security faces a shortfall. Its retirement trust fund is projected to run out in late 2032. After that, incoming taxes would cover about 78% of scheduled benefits unless Congress acts.
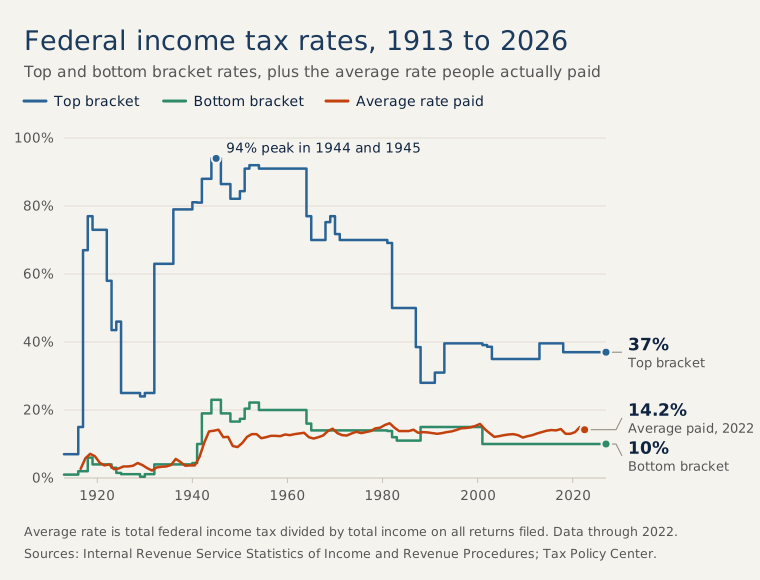
View the data behind this chart
| Tax year | Top bracket | Bottom bracket | Average rate paid |
|---|---|---|---|
| 1913 | 7% | 1% | Not available |
| 1914 | 7% | 1% | Not available |
| 1915 | 7% | 1% | Not available |
| 1916 | 15% | 2% | 2.7% |
| 1917 | 67% | 2% | 5.8% |
| 1918 | 77% | 6% | 7.1% |
| 1919 | 73% | 4% | 6.4% |
| 1920 | 73% | 4% | 4.5% |
| 1921 | 73% | 4% | 3.7% |
| 1922 | 58% | 4% | 4.0% |
| 1923 | 43.5% | 3% | 2.6% |
| 1924 | 46% | 1.5% | 2.8% |
| 1925 | 25% | 1.125% | 3.4% |
| 1926 | 25% | 1.125% | 3.4% |
| 1927 | 25% | 1.125% | 3.6% |
| 1928 | 25% | 1.125% | 4.4% |
| 1929 | 24% | 0.375% | 3.8% |
| 1930 | 25% | 1.125% | 2.9% |
| 1931 | 25% | 1.125% | 2.2% |
| 1932 | 63% | 4% | 3.1% |
| 1933 | 63% | 4% | 3.3% |
| 1934 | 63% | 4% | 3.4% |
| 1935 | 63% | 4% | 3.8% |
| 1936 | 79% | 4% | 5.6% |
| 1937 | 79% | 4% | 4.7% |
| 1938 | 79% | 4% | 3.6% |
| 1939 | 79% | 4% | 3.7% |
| 1940 | 81.1% | 4.4% | 3.7% |
| 1941 | 81% | 10% | 6.2% |
| 1942 | 88% | 19% | 10.4% |
| 1943 | 88% | 19% | 13.7% |
| 1944 | 94% | 23% | 13.9% |
| 1945 | 94% | 23% | 14.2% |
| 1946 | 86.45% | 19% | 12.0% |
| 1947 | 86.45% | 19% | 12.1% |
| 1948 | 82.13% | 16.6% | 9.4% |
| 1949 | 82.13% | 16.6% | 9.1% |
| 1950 | 84.36% | 17.4% | 10.3% |
| 1951 | 91% | 20.4% | 12.1% |
| 1952 | 92% | 22.2% | 12.9% |
| 1953 | 92% | 22.2% | 12.9% |
| 1954 | 91% | 20% | 11.7% |
| 1955 | 91% | 20% | 12.0% |
| 1956 | 91% | 20% | 12.4% |
| 1957 | 91% | 20% | 12.4% |
| 1958 | 91% | 20% | 12.3% |
| 1959 | 91% | 20% | 12.8% |
| 1960 | 91% | 20% | 12.6% |
| 1961 | 91% | 20% | 12.9% |
| 1962 | 91% | 20% | 13.1% |
| 1963 | 91% | 20% | 13.3% |
| 1964 | 77% | 16% | 12.0% |
| 1965 | 70% | 14% | 11.6% |
| 1966 | 70% | 14% | 12.0% |
| 1967 | 70% | 14% | 12.5% |
| 1968 | 75.25% | 14% | 13.8% |
| 1969 | 77% | 14% | 14.5% |
| 1970 | 71.75% | 14% | 13.2% |
| 1971 | 70% | 14% | 12.6% |
| 1972 | 70% | 14% | 12.5% |
| 1973 | 70% | 14% | 13.1% |
| 1974 | 70% | 14% | 13.6% |
| 1975 | 70% | 14% | 13.2% |
| 1976 | 70% | 14% | 13.5% |
| 1977 | 70% | 14% | 13.8% |
| 1978 | 70% | 14% | 14.6% |
| 1979 | 70% | 14% | 14.8% |
| 1980 | 70% | 14% | 15.6% |
| 1981 | 69.125% | 13.825% | 16.1% |
| 1982 | 50% | 12% | 14.8% |
| 1983 | 50% | 11% | 13.8% |
| 1984 | 50% | 11% | 13.8% |
| 1985 | 50% | 11% | 13.8% |
| 1986 | 50% | 11% | 14.2% |
| 1987 | 38.5% | 11% | 13.3% |
| 1988 | 28% | 15% | 13.5% |
| 1989 | 28% | 15% | 13.4% |
| 1990 | 28% | 15% | 13.2% |
| 1991 | 31% | 15% | 13.0% |
| 1992 | 31% | 15% | 13.2% |
| 1993 | 39.6% | 15% | 13.5% |
| 1994 | 39.6% | 15% | 13.7% |
| 1995 | 39.6% | 15% | 14.1% |
| 1996 | 39.6% | 15% | 14.6% |
| 1997 | 39.6% | 15% | 14.7% |
| 1998 | 39.6% | 15% | 14.9% |
| 1999 | 39.6% | 15% | 15.3% |
| 2000 | 39.6% | 15% | 15.9% |
| 2001 | 39.1% | 10% | 14.4% |
| 2002 | 38.6% | 10% | 13.2% |
| 2003 | 35% | 10% | 12.1% |
| 2004 | 35% | 10% | 12.3% |
| 2005 | 35% | 10% | 12.6% |
| 2006 | 35% | 10% | 12.8% |
| 2007 | 35% | 10% | 12.9% |
| 2008 | 35% | 10% | 12.6% |
| 2009 | 35% | 10% | 11.9% |
| 2010 | 35% | 10% | 12.3% |
| 2011 | 35% | 10% | 12.6% |
| 2012 | 35% | 10% | 13.1% |
| 2013 | 39.6% | 10% | 13.5% |
| 2014 | 39.6% | 10% | 13.9% |
| 2015 | 39.6% | 10% | 14.1% |
| 2016 | 39.6% | 10% | 14.0% |
| 2017 | 39.6% | 10% | 14.4% |
| 2018 | 37% | 10% | 13.0% |
| 2019 | 37% | 10% | 13.0% |
| 2020 | 37% | 10% | 13.5% |
| 2021 | 37% | 10% | 15.0% |
| 2022 | 37% | 10% | 14.2% |
| 2023 | 37% | 10% | Not available |
| 2024 | 37% | 10% | Not available |
| 2025 | 37% | 10% | Not available |
| 2026 | 37% | 10% | Not available |
Bracket rates for 1913 to 2002 come from the Internal Revenue Service’s Statistics of Income program. Rates for 2003 to 2023 come from the Tax Policy Center. Rates for 2024 to 2026 come from Internal Revenue Service Revenue Procedures and news releases. The average rate for 1916 to 2000 is income tax before credits divided by total income, from the Statistics of Income study “Ninety Years of Individual Income and Tax Statistics.” The average rate for 2001 to 2022 is income tax after credits divided by adjusted gross income, from the Individual Income Tax Returns Complete Report.
No one knows how Congress will respond. It could raise taxes, cut spending, or do some of both. But paying tax at a known rate today, instead of an unknown rate later, can be worth weighing.
What Still Makes a Conversion Worth It
A few reasons hold up no matter what Congress does:
- Filling a low bracket. Some years your income dips, like after you stop working but before Social Security or required withdrawals begin. Converting in those years can use up a low bracket that would otherwise go unused.
- Leaving tax-free money to your kids. Since 2020, most heirs must empty an inherited IRA by the end of the 10th year after the owner’s death. Withdrawals from an inherited traditional IRA count as taxable income for the heir. Withdrawals from an inherited Roth IRA are generally tax-free once the original owner’s five-year mark has passed. Some heirs follow different rules, including a spouse, a minor child, and a loved one with a disability or a chronic illness. If a special needs trust is the beneficiary, the trust’s wording matters. Talk with the attorney who drafted it.
- Skipping required withdrawals. Roth IRAs have no required withdrawals for the original owner, so the money can stay invested as long as you like.
- Spreading your savings across account types. Having both pre-tax and Roth money means your future is not tied to a single tax rate.
Each of these depends on your own numbers, in your own year.
The Pro-Rata Rule Catches People Who Try to Cherry-Pick
If you have ever made a nondeductible contribution to an IRA, meaning you did not get a tax deduction for it, you might think you can convert just that amount tax-free. You cannot.
The Internal Revenue Service (IRS) adds up every traditional IRA you own, as of December 31 of the conversion year. It does not look at each account separately. Then it treats your conversion as coming out in that same mix of pre-tax and after-tax money, proportionally.
Workplace plans like a 401(k) or 403(b) are not part of this math, unless you roll them into an IRA during that same year. That is one reason some people roll a 401(k) into a new employer’s plan instead of an IRA, to keep the pro-rata math clean.
Two Different Five-Year Clocks
People confuse these constantly, so here they are side by side.
The first clock covers your Roth account’s earnings. It starts on January 1 of the first tax year for which you made a contribution to any Roth IRA. Once five years pass and you are 59 and a half, the earnings come out tax-free.
The second clock covers each conversion separately. If you are under 59 and a half, each amount you convert has its own five-year wait before you can pull that specific amount back out without a 10% penalty. Convert in three different years and you have three different five-year clocks running.
Two Costs That Are Easy to Miss
A conversion counts as income the year you do it. That can trigger costs that have nothing to do with your tax bracket.
If you are on Medicare, a bigger income can raise your Medicare premiums two years later. These added charges are called IRMAA (Medicare income surcharges). We cover those numbers in “The Deadline That Does Not Move: Medicare and IRMAA in 2026.”
There is a newer one, too. The OBBBA created an extra $6,000 tax deduction for each person 65 and older, for tax years 2025 through 2028. It starts to shrink once your income passes $75,000 for single filers or $150,000 for married couples filing jointly. Each $6,000 shrinks by $60 for every $1,000 of income over that line. For a married couple where both spouses are 65 or older, that is up to $12,000 in deductions at stake, shrinking by $120 for every $1,000. It is gone completely at $175,000 single or $250,000 joint. That lost deduction adds to the cost of the conversion itself. Under current law, the deduction ends after 2028, so this cost applies only to conversions made from 2025 through 2028.
Neither of these caps how much you can convert. They just mean the true cost can run higher than the tax bracket alone suggests.
Key takeaway: The scheduled 2026 tax increase is gone, but today’s rates are only as permanent as the next Congress allows. With tax brackets low by historical standards, federal debt near a record, and Social Security facing a shortfall, paying tax at a known rate now deserves a look. Balance that against real costs like IRMAA and the senior deduction phaseout that a bigger income can trigger.
A Small Note for North Carolina
North Carolina taxes a Roth conversion as regular income too, same as the federal government. The state’s flat rate dropped to 3.99% in 2026, down from 4.25% in 2025. It is a small change, but it makes converting a little cheaper at the state level.
Before You Convert
If you are also selling any losing investments this year, do that math first. Losses left over after offsetting your gains can cancel out up to $3,000 a year of the income a conversion creates, with anything extra carried forward. We cover that in “Tax-Loss Harvesting Before Year-End: What It Actually Saves You.”
If you want help running your own numbers, a Trailhead Meeting is a good place to start.
This article is for informational purposes only and does not constitute personalized tax or investment advice. Consult a certified public accountant (CPA) or other qualified tax professional before acting on any strategy described here. Figures current as of September 2026 and subject to change.